Key takeaways
A BMI chart lets you instantly identify which weight category applies to your height and weight. The WHO distinguishes six categories, from underweight to severe obesity. BMI is a useful starting point, but only gives a complete picture when combined with waist circumference and other measurements.
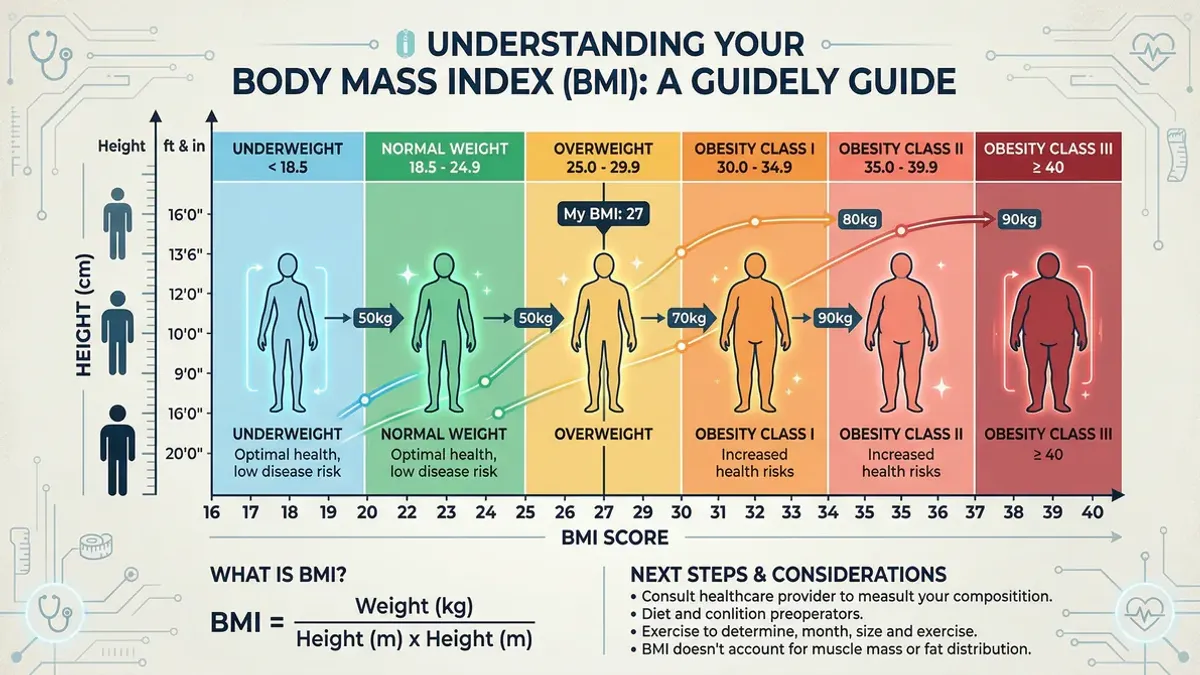
How does a BMI chart work?
A BMI chart combines your height (vertical axis) and weight (horizontal axis) to give your BMI value and category at a glance — no calculation required. If you prefer to calculate it yourself, the formula is: weight (kg) ÷ height² (m).
For a full explanation of the formula, see: BMI calculator: calculate your body mass index.
Full BMI chart for adults (WHO standards)
Category overview
| BMI value | Category | Health risk |
|---|---|---|
| Below 16.0 | Severe underweight | Very high |
| 16.0 – 16.9 | Moderate underweight | High |
| 17.0 – 18.4 | Mild underweight | Moderately elevated |
| 18.5 – 24.9 | Healthy weight | Low (reference level) |
| 25.0 – 29.9 | Overweight (pre-obesity) | Slightly elevated |
| 30.0 – 34.9 | Obesity class I | Moderately elevated |
| 35.0 – 39.9 | Obesity class II | Severely elevated |
| 40.0 or above | Obesity class III (morbid) | Very severely elevated |
BMI by height and weight — reference table
Find your row (height) and column (weight) to read off your approximate BMI:
| Height \ Weight | 50 kg | 55 kg | 60 kg | 65 kg | 70 kg | 75 kg | 80 kg | 85 kg | 90 kg | 95 kg | 100 kg |
|---|---|---|---|---|---|---|---|---|---|---|---|
| 1.55 m | 20.8 | 22.9 | 25.0 | 27.1 | 29.1 | 31.2 | 33.3 | 35.4 | 37.4 | 39.5 | 41.6 |
| 1.60 m | 19.5 | 21.5 | 23.4 | 25.4 | 27.3 | 29.3 | 31.3 | 33.2 | 35.2 | 37.1 | 39.1 |
| 1.65 m | 18.4 | 20.2 | 22.0 | 23.9 | 25.7 | 27.5 | 29.4 | 31.2 | 33.1 | 34.9 | 36.7 |
| 1.70 m | 17.3 | 19.0 | 20.8 | 22.5 | 24.2 | 26.0 | 27.7 | 29.4 | 31.1 | 32.9 | 34.6 |
| 1.75 m | 16.3 | 18.0 | 19.6 | 21.2 | 22.9 | 24.5 | 26.1 | 27.8 | 29.4 | 31.0 | 32.7 |
| 1.80 m | 15.4 | 17.0 | 18.5 | 20.1 | 21.6 | 23.1 | 24.7 | 26.2 | 27.8 | 29.3 | 30.9 |
| 1.85 m | 14.6 | 16.1 | 17.5 | 19.0 | 20.5 | 21.9 | 23.4 | 24.8 | 26.3 | 27.8 | 29.2 |
| 1.90 m | 13.9 | 15.2 | 16.6 | 18.0 | 19.4 | 20.8 | 22.2 | 23.5 | 24.9 | 26.3 | 27.7 |
Values in the healthy range (BMI 18.5–24.9) represent the reference zone for lowest health risk.
What do the BMI categories mean?
Underweight (BMI below 18.5)
Underweight may lead to nutritional deficiencies, a weakened immune system, bone loss, and fertility issues. Causes range from insufficient calorie intake to underlying medical conditions. Persistent underweight warrants a consultation with a GP or dietitian.
Healthy weight (BMI 18.5–24.9)
This is the reference range associated with the lowest health risk. Within this range, a BMI of 20–22 is statistically associated with the lowest disease incidence. Maintaining this range through balanced nutrition and regular physical activity is the goal of most health promotion guidelines.
Overweight (BMI 25–29.9)
Overweight increases the risk of type 2 diabetes, cardiovascular disease, and joint problems. However, risk is strongly influenced by fat distribution: abdominal fat is more harmful than fat on the hips or thighs. A person with a BMI of 27 but a normal waist circumference carries less risk than someone with a BMI of 25 but a large abdominal circumference.
Obesity class I (BMI 30–34.9)
At obesity class I, the risk of chronic conditions is clearly elevated. The presence of additional risk factors — high blood pressure, high cholesterol, smoking — compounds this risk. Lifestyle change (improved diet and increased activity) is the first-line approach; medical or surgical intervention is considered when lifestyle change is insufficient or comorbidities are present.
Obesity classes II and III (BMI ≥ 35)
Severe obesity is associated with greatly elevated risk of cardiovascular disease, type 2 diabetes, certain cancers, sleep apnoea, and joint disorders. Medical supervision is typically necessary for these categories.
Limitations of the BMI chart
The BMI chart is a useful first reference, but does not account for:
- Muscle mass: An athlete may have a high BMI without excess fat
- Fat distribution: Abdominal fat carries greater risk than fat elsewhere
- Age: Older adults carry more body fat at the same BMI
- Sex: Women carry more body fat than men at the same BMI — see BMI for women for specific considerations
- Ethnic background: For people of Asian descent, health risks begin at lower BMI values
Waist circumference as a complement
The most reliable way to assess health risk is by combining BMI with waist circumference:
| Sex | Normal | Elevated risk | High risk |
|---|---|---|---|
| Men | Below 94 cm | 94–102 cm | Above 102 cm |
| Women | Below 80 cm | 80–88 cm | Above 88 cm |
For a broader assessment incorporating multiple measurements, see: calculating a healthy weight: beyond BMI.
BMI targets for weight loss
If you want to lose weight, setting a realistic BMI target is helpful. Practical milestones:
- First target: BMI below 30 (out of the obesity range)
- Intermediate target: BMI below 27 (mid-overweight)
- Long-term target: BMI within the healthy weight range (18.5–24.9)
A weight loss of 5–10% of starting body weight has demonstrable health benefits, even if BMI remains in the overweight zone.
Pair a BMI target with a concrete action plan: a calorie deficit, optimised protein intake, and regular exercise. Moveno makes it easy to track your calorie intake with a simple photo of your meals. Use our calorie tracking beginner's guide, calculate your calorie deficit, and read about daily protein needs.
Sources
- World Health Organisation. (2000). Obesity: preventing and managing the global epidemic. WHO Technical Report Series 894. apps.who.int/iris/handle/10665/42330
- Nuttall FQ. (2015). Body Mass Index: Obesity, BMI, and Health: A Critical Review. Nutrition Today. doi.org/10.1097/NT.0000000000000092
- Flegal KM et al. (2013). Association of all-cause mortality with overweight and obesity using standard body mass index categories. JAMA. doi.org/10.1001/jama.2012.113905
- RIVM. (2023). Overweight in adults. National Institute for Public Health and the Environment. rivm.nl
Want to work towards a healthier weight? With Moveno, tracking what you eat takes less than a minute per meal — just take a photo.