Key takeaways
The BMI formula is identical for women and men — weight divided by height squared — but the interpretation differs. Women naturally carry a higher percentage of body fat than men at the same BMI, and the distribution of fat plays a specific role in women's health outcomes. A BMI of 22–23 is considered optimal for women, and waist circumference is a critical additional measurement.
The BMI formula for women
The calculation is the same for everyone:
BMI = weight (kg) ÷ height² (m)
Worked example for a woman
A woman weighs 65 kg and is 1.68 m tall:
- Height squared: 1.68 × 1.68 = 2.8224
- BMI: 65 ÷ 2.8224 = 23.0
This falls within the 'healthy weight' category (18.5–24.9).
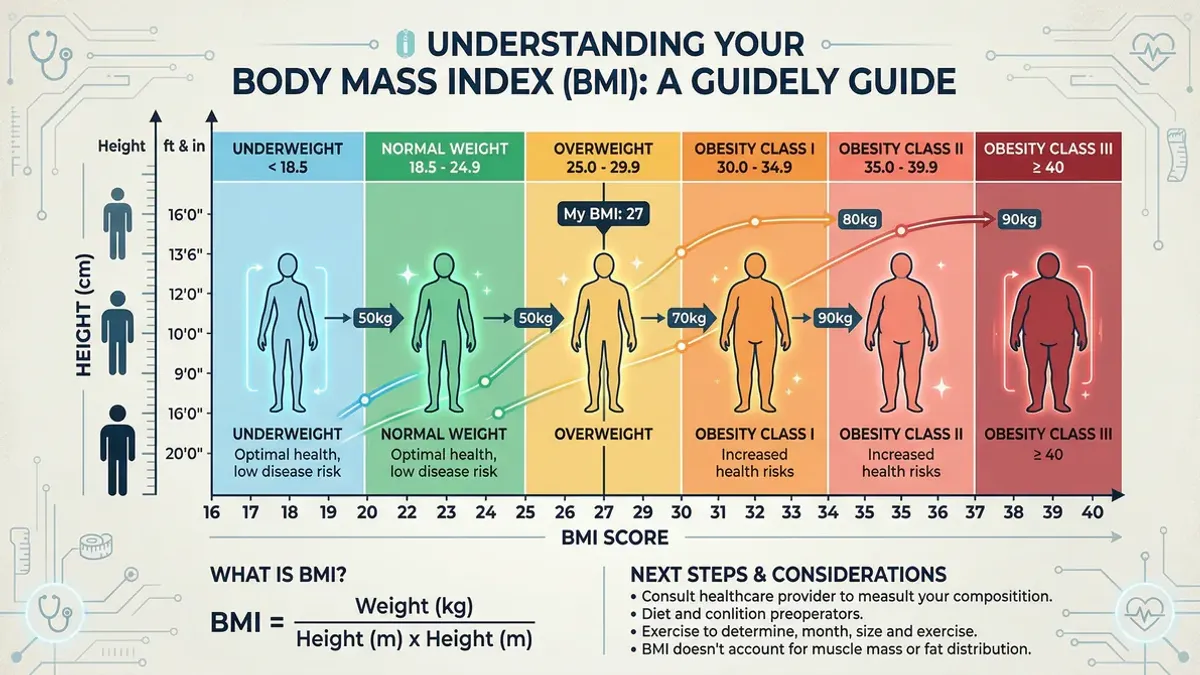
Standard BMI categories
The WHO uses the same categories for women and men:
| BMI | Category |
|---|---|
| Below 18.5 | Underweight |
| 18.5 – 24.9 | Healthy weight |
| 25.0 – 29.9 | Overweight |
| 30.0 and above | Obesity |
Why BMI means something different for women
At the same BMI, women and men have significantly different body fat percentages. A woman with a BMI of 24 typically has 30–35% body fat; a man with the same BMI averages around 20–25%. This difference is biologically normal and related to reproductive function.
This means the threshold for 'excess body fat' in women does not map neatly onto BMI values. Clinically, the following body fat ranges are used as reference for women:
- Essential fat: 10–13%
- Athletic: 14–20%
- Fit: 21–24%
- Acceptable: 25–31%
- Overweight: 32% or more
What is an optimal BMI for women?
Within the 'healthy weight' category (18.5–24.9), a BMI of 22–23 is statistically associated with the lowest disease risk for women. Epidemiological research suggests this range offers the best balance of short- and long-term health outcomes.
That said, this is a population average. Individual factors — build, muscle mass, age, and genetics — all play a role. An athletic woman may be in excellent health at a BMI of 25.
Age and BMI in women
Body composition changes with age regardless of weight:
- Ages 20–40: BMI standards are most accurate
- Ages 40–60: Muscle loss (sarcopenia) begins; BMI may underestimate body fat
- Ages 60+: Significant muscle loss possible; BMI can paint an overly optimistic picture
After menopause, fat distribution often shifts from the hips and thighs to the abdomen. Visceral fat is metabolically active and contributes more to cardiovascular disease risk than subcutaneous fat elsewhere. This makes waist circumference increasingly important relative to BMI for older women.
Waist circumference: the essential companion
For women, a waist circumference below 80 cm is considered normal risk. Above 88 cm, there is substantially elevated risk of metabolic conditions including type 2 diabetes, cardiovascular disease, and hypertension.
Measure at the narrowest point of the torso, midway between the lowest rib and the top of the hip bone. Use a flexible tape measure and breathe out gently before recording.
| Waist circumference | Risk level |
|---|---|
| Below 80 cm | Normal risk |
| 80 – 88 cm | Elevated risk |
| Above 88 cm | High risk |
For a broader assessment of healthy weight, see: calculating a healthy weight: beyond BMI.
BMI during and after pregnancy
BMI is not a meaningful measure during pregnancy. After giving birth, the body typically needs 6–12 months to return towards pre-pregnancy weight, depending on breastfeeding, physical activity, and nutrition. If you have questions about post-pregnancy weight, always consult your midwife or GP rather than relying on BMI targets.
BMI and hormonal changes
The menstrual cycle, hormonal contraception, thyroid conditions, and the menopause can all influence weight — and therefore BMI. Fluctuations of 1–3 kg during the cycle are normal and have no bearing on fat mass.
If your BMI rises despite no change in diet or activity levels, a hormonal blood panel with your GP may provide more useful information.
Additional measurements relevant for women
Beyond waist circumference:
- Waist-to-hip ratio (WHR): Below 0.85 is normal for women; above 0.85 is a risk factor
- Body fat percentage: More informative than BMI for women who exercise regularly
- Waist-to-height ratio: Waist circumference divided by height; below 0.5 is associated with lower health risk
Tracking your progress
If you are actively working towards a healthier body composition, tracking your nutrition is one of the most effective tools available. With Moveno, simply photograph your meals to see calories and nutritional values instantly — useful when managing your weight over time. Also use our calorie tracking beginner's guide, calculate your calorie deficit, and learn to boost your metabolism.
Sources
- Gallagher D. et al. (1996). How useful is body mass index for comparison of body fatness across age, sex, and ethnic groups? American Journal of Epidemiology. doi.org/10.1093/oxfordjournals.aje.a008733
- Jackson AS. et al. (2002). The effect of sex, age and race on estimating percentage body fat from body mass index. International Journal of Obesity. doi.org/10.1038/sj.ijo.0802006
- Janssen I. et al. (2002). Body mass index, waist circumference, and health risk. Archives of Internal Medicine. doi.org/10.1001/archinte.162.18.2074
- World Health Organisation. (2008). Waist circumference and waist-hip ratio: report of a WHO expert consultation. apps.who.int
Want to track your calorie intake and support your health goals? With Moveno, simply photograph your meals to see nutritional values instantly.