Key takeaways
A healthy weight is more than a number on the scales or a BMI score. It depends on the ratio of body fat to muscle mass, and on where fat is stored. The most reliable assessment combines BMI, waist circumference, waist-to-hip ratio, and body fat percentage. Together, these measurements give an accurate picture of your actual health risk.
Why weight is more than a number
Two people of the same height and weight can have very different health risks. An active woman of 70 kg with 22% body fat and a waist of 75 cm is metabolically healthier than an inactive woman at the same weight with 38% body fat and a waist of 90 cm.
A bathroom scale cannot distinguish between fat, muscle, bone, and water. It is the composition — and distribution — of body mass that determines the risk of chronic conditions such as type 2 diabetes, cardiovascular disease, and joint disorders.
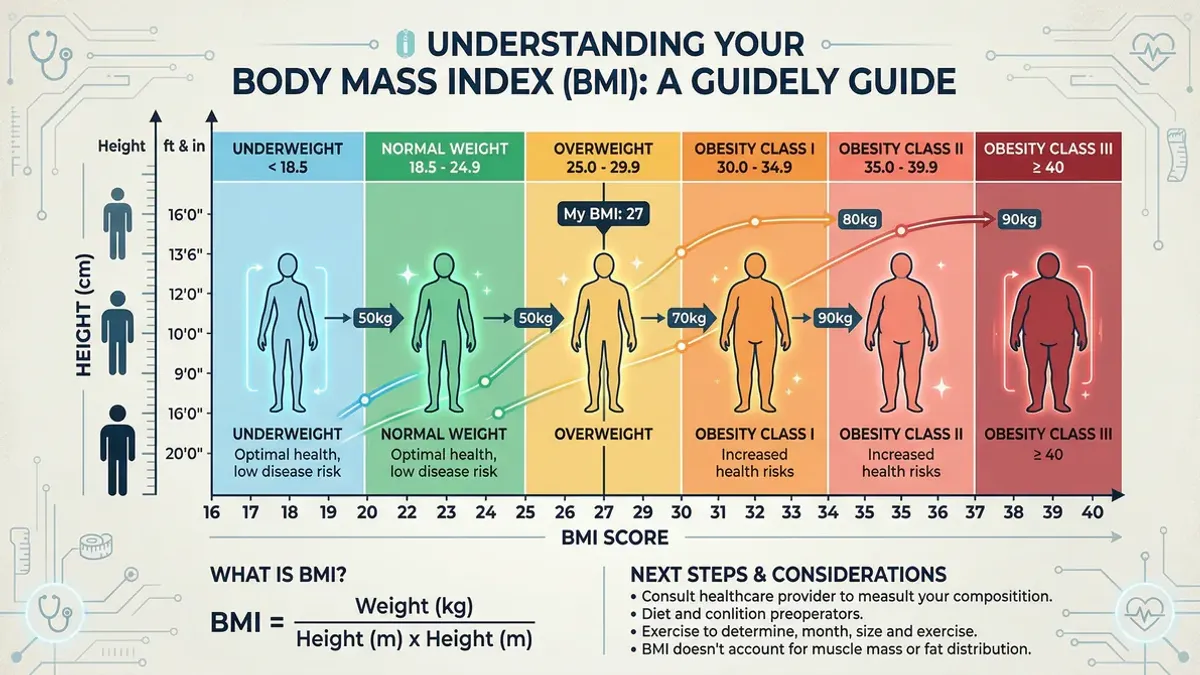
Method 1: BMI
Body Mass Index is the most widely known method:
BMI = weight (kg) ÷ height² (m)
| BMI | Category |
|---|---|
| Below 18.5 | Underweight |
| 18.5 – 24.9 | Healthy weight |
| 25 – 29.9 | Overweight |
| ≥ 30 | Obesity |
Advantage: Quick and easy to calculate. Limitation: Does not account for muscle mass, fat distribution, age, or sex.
For a detailed explanation, see: BMI calculator and BMI chart.
Method 2: Waist circumference
Waist circumference directly measures abdominal fat — the most metabolically harmful fat type. Measure at the narrowest point of the torso, midway between the lowest rib and the hip crest. Breathe out gently before measuring.
| Sex | Normal | Elevated risk | High risk |
|---|---|---|---|
| Men | Below 94 cm | 94–102 cm | Above 102 cm |
| Women | Below 80 cm | 80–88 cm | Above 88 cm |
For many clinicians, waist circumference is a more reliable predictor of cardiovascular disease and diabetes than BMI. Understanding how your metabolism influences fat storage can also help you work towards a healthier composition.
Method 3: Waist-to-hip ratio (WHR)
The waist-to-hip ratio indicates whether fat is stored centrally (abdomen) or peripherally (hips and thighs):
WHR = waist circumference (cm) ÷ hip circumference (cm)
Measure the hips at the widest point (across the buttocks).
| Sex | Normal | Elevated risk |
|---|---|---|
| Men | Below 0.90 | ≥ 0.90 |
| Women | Below 0.85 | ≥ 0.85 |
An 'apple shape' (fat around the abdomen) carries greater health risk than a 'pear shape' (fat around hips and thighs). The WHR makes this distinction immediately visible.
Method 4: Waist-to-height ratio
A simple but powerful metric:
Waist-to-height ratio = waist circumference (cm) ÷ height (cm)
A value below 0.5 is associated with low cardiovascular risk across multiple studies, regardless of age or sex. Above 0.5, risk increases.
Example: waist 82 cm, height 170 cm → 82 ÷ 170 = 0.48 ✅
This is one of the most consistent predictors of metabolic health in the international literature.
Method 5: Body fat percentage
Body fat percentage represents the proportion of body fat relative to total body weight. It is the most direct measure of body composition, but requires a measurement — skinfold callipers, bioelectrical impedance, DEXA scan, or hydrostatic weighing.
Reference values for adults:
| Category | Men | Women |
|---|---|---|
| Essential fat | 2–5% | 10–13% |
| Athletic | 6–13% | 14–20% |
| Fit | 14–17% | 21–24% |
| Acceptable | 18–24% | 25–31% |
| Overweight | 25%+ | 32%+ |
For home use, bioelectrical impedance analysis (BIA) via a smart scale is the most accessible method, though less accurate than DEXA. Measure first thing in the morning, fasted, for the most consistent results.
Calculating ideal weight: the Devine formula
The Devine formula provides an indication of 'ideal' weight based on height:
- Men: 50 kg + 2.3 kg per 2.54 cm above 152 cm
- Women: 45.5 kg + 2.3 kg per 2.54 cm above 152 cm
Example for a man of 180 cm: 180 – 152 = 28 cm above threshold → 28 ÷ 2.54 × 2.3 = 25.4 kg extra Ideal weight: 50 + 25.4 = 75.4 kg
Note: this is an indication, not a target. Muscle mass, frame size, and age mean that individual healthy weight may differ substantially from formula outputs.
Which method should you use?
No single method gives a complete picture on its own. The best approach combines several:
| Method | What it measures | When most useful |
|---|---|---|
| BMI | Weight-to-height ratio | Initial screening |
| Waist circumference | Abdominal fat | Cardiovascular risk |
| Waist-to-hip ratio | Fat distribution | Apple vs. pear shape |
| Waist-to-height ratio | Central fat | Quick risk check |
| Body fat percentage | Body composition | Most accurate picture |
For most people: measure BMI and waist circumference. That combination is sufficient for a reliable home assessment.
The effect of age on healthy weight
As you age, you lose muscle mass (sarcopenia). This can mean weight stays stable while body fat percentage rises. People over 60 may have a 'normal' BMI while carrying metabolically significant amounts of fat.
For people over 65, a slightly higher BMI (up to 27) may be associated with better outcomes during illness and recovery — the so-called 'obesity paradox'. This is a reason to pay particular attention to muscle mass alongside weight in older adults.
Practical: tracking weight and nutrition
If you are actively working on your body composition, tracking your nutritional intake is one of the most effective tools available. Moveno makes it straightforward: photograph your meals and instantly see the calorie and macronutrient breakdown. Pair daily food logging with weekly waist measurements and regular weigh-ins for the most reliable picture of your progress. Start with our calorie tracking beginner's guide and use a calorie deficit calculator to set a concrete target.
Sources
- Ashwell M, Gunn P, Gibson S. (2012). Waist-to-height ratio is a better screening tool than waist circumference and BMI for adult cardiometabolic risk factors. Obesity Reviews. doi.org/10.1111/j.1467-789X.2011.00952.x
- Janssen I et al. (2002). Body mass index and waist circumference independently contribute to the prediction of nonabdominal, abdominal subcutaneous, and visceral fat. American Journal of Clinical Nutrition. doi.org/10.1093/ajcn/75.4.683
- Flegal KM et al. (2013). Association of all-cause mortality with overweight and obesity using standard body mass index categories. JAMA. doi.org/10.1001/jama.2012.113905
- Prentice AM, Jebb SA. (2001). Beyond body mass index. Obesity Reviews. doi.org/10.1046/j.1467-789x.2001.00031.x
Want to track your nutrition while working towards a healthier body composition? With Moveno, photograph your meals and see all nutritional values instantly.